
In the previous post I introduced the spectral leakage phenomena. Now you know where does it come from and how does it affect the spectrum. But how do we deal with it? What is the solution for reducing this unwanted effect?
To understand how can we reduce the spectral leakage we must remember where does it come from. If the signal does not contain full number of periods in the observation window (and in most practical cases it does not), after the repetition we end up with the discontinuity.
Take a look at following example:
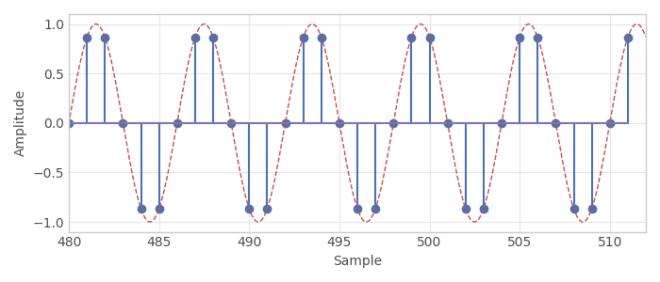
This is a pure sine wave, with the parameters as in the previous post i.e. frequency 

The DFT result of such signal should contain only two components. Instead of many neighboring components are non-zero. This can lead to misinterpretation of the results. 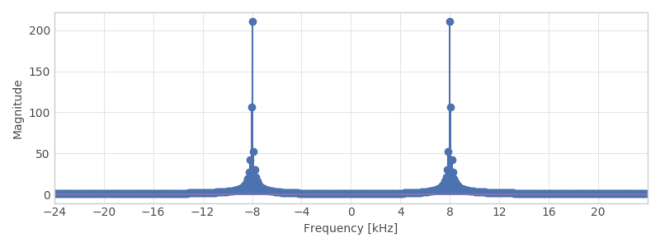 To overcome this problem we should reduce the impact of discontinuity of the signal. We can do this by using windows in time domain. Let’s try to do it by suppressing the signal at the beginning and at the end – this is where the discontinuity appears. If we multiply the signal by the e.g. triangle window, we should reduce the difference between consecutive samples in the repetitions.
The triangle window can be expressed with following formula:

And the window itself looks as follows:
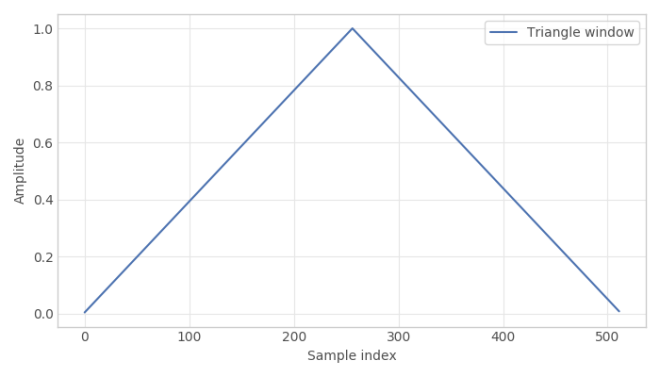
As you can see it linearly decreases the amplitude from 1 in the middle down to 0 at the ends.
You can easily imagine other shapes of window with such, or at least similar properties. And sure, there are others which we can consider. In this post we will verify following windows:
- rectangular – this window is always used indirectly, by taking a signal of some length. We cannot take the infinite signal for DFT analysis, and therefor we have some beginning and some end of the signal – this is equivalent to applying rectangular window
- triangle
- Hamming – it is based on the properly raised and scaled cosine function
- Blackman – similarly to Hamming, but two cosine components are used
- Bohman – not only based on cosine, but has also applied triangle function on it
Different windows have different properties, which we will investigate. Let’s compare the windows in the time domain first:
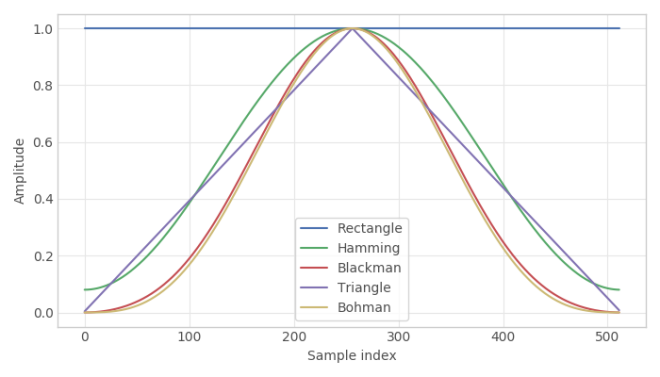
As you can see some of the windows are very alike (e.g Bohman and Blackman). It is worth noting that Hamming window does not hit zeros at the ends, which means that signal will not be fully suppressed at the connection spot of the repetitions. Rectangular window is simply constant 1 value over the whole length.
So, how does the signal looks like after the applying windows?
Here you go:
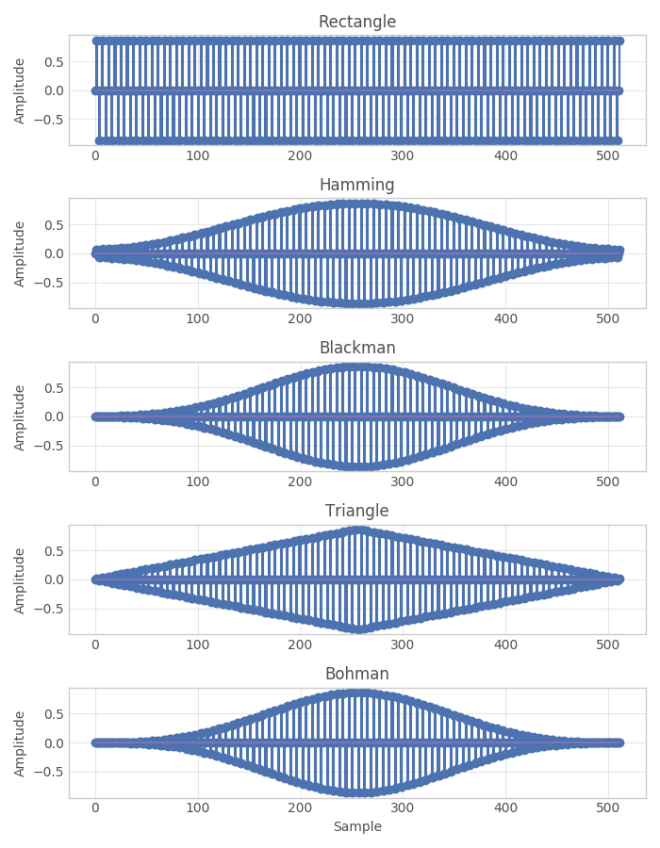
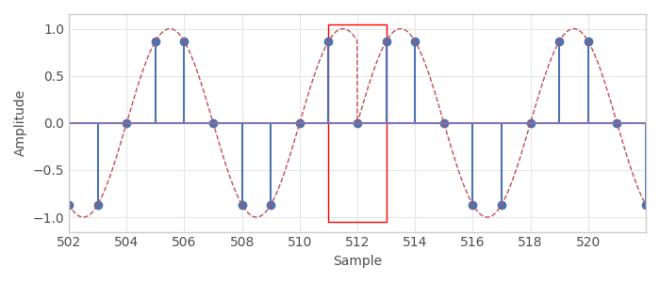
As expected – rectangle window does not change signal at all and all other windows tend to attenuate the signal at the edges. We can take closer look at the signal after the repetition:


In case of rectangular window (left plot) have an ugly discontinuity, which can be hardly seen in case of triangle window (right plot).
If we calculate the DFT of windowed signals, we can expect some improvements. Let’s take a look on the DFT result of the windowed signal:
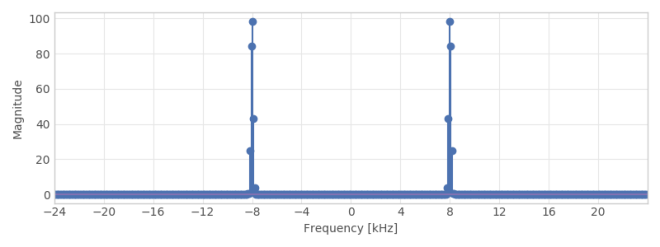
We sure can see that the result is better, but of course not perfect. Aside from four, maybe five components per each peak, all other samples seems to be zero.
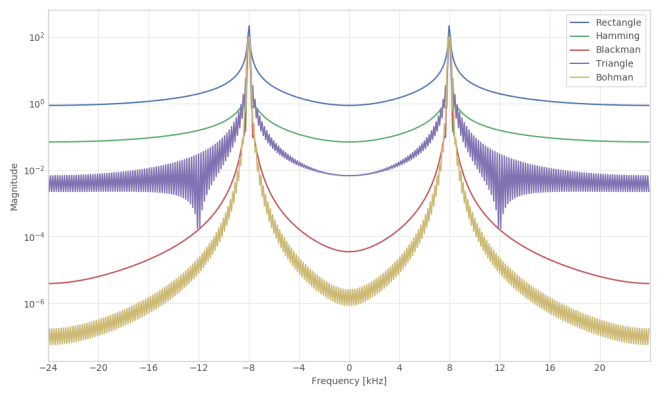
In order to get a better grasp the difference between windows we will analyze the results in a logarithmic scale. Most of the differences between windows (except from rectangular) are not visible in linear scale.
 As you can see we got nice results. By applying the window we are interested in few things (not always all of them at once!);
- get as narrow peak as possible
- get peak height as close to the actual height as possible (height represents power, which is reduced by the window)
- get as low “noise” level as possible – where the noise is area between the peaks
To fully analyze what windows offer we can take a closer look at the single peak:
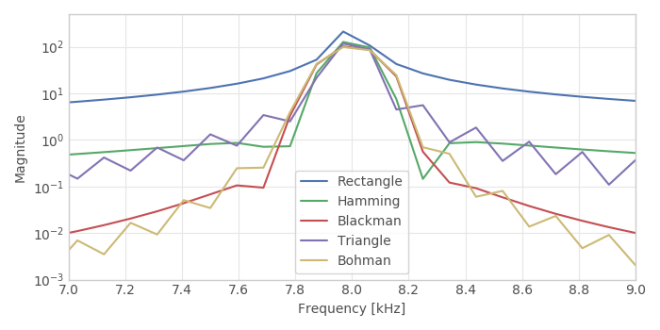
From both figures we can draw some conclusions:
- Bohman window offers lowest level of the spectrum between peaks
- Hamming window gives the narrowest peak
- Hamming window changes power to the slightest extent (except rectangular window, which does not change power at all)
- Triangle and Bohman window (since it has triangle component) introduce “flickering” spectrum; spectrum from other windows is smooth. This is related to the discontinuity of the triangle function
- Hamming has highest “noise” level (except rectangular) – just for a purpose of not drawing conclusion that Hamming is best and all-in-one window
The final conclusion is as follows: choose such window that suits your needs best – if you want precise frequency, go with the Hamming, if you expect some very low power signal aside from the main tone use Bohman, as it has very low level between peaks.
You can also experiment with other windows. These were just some commonly used examples.
I hope you find this post interesting and helpful. If you are interested I can provide the python code for generating those signals, windows and plots. Feel free to leave a comment or question.
