
One of the basic tools, that is commonly used in signal processing is fast Fourier transform (FFT). It is used to calculate representation of the signal in the frequency domain. As it is so popular it is important to understand what can we expect from this tool and how to properly use it. We will consider two examples, which will focus on different aspects of FFT.
Example 1 – FFT size selection
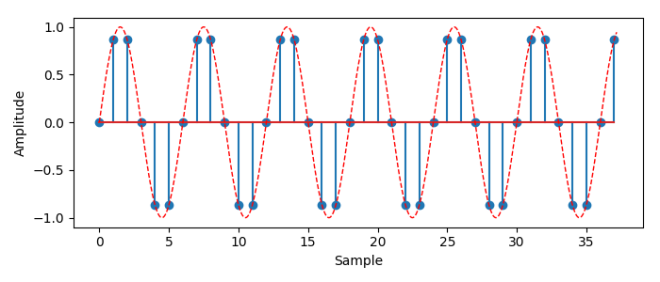
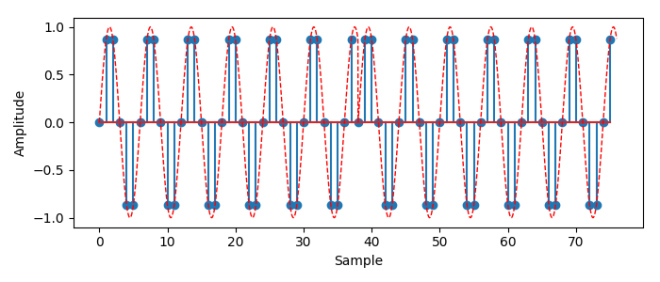
Let’s start with analyzing exemplary input signal. For simplicity we can use sine wave, as the spectrum of such signal is well known. Red dashed line represents analog signal, which was sampled at 

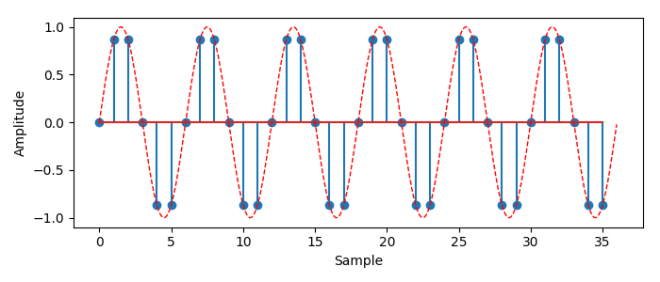
Knowing all that we can proceed to the spectrum calculation. Having just a single tone in our test signal we expect two, clean Kronecker deltas at -8kHz and 8kHz. As we will see in the FFT examples, this will not always be the case.
We can calculate the FFT using any method. I use python, since it is free, easy to learn and fast to develop. There are various FFT implementations available, but I will stick to one of the most popular, namely scipy package.
import scipy.fftpack as fft

n_point = 36
spectrum = fft.fft(signal, n_point)
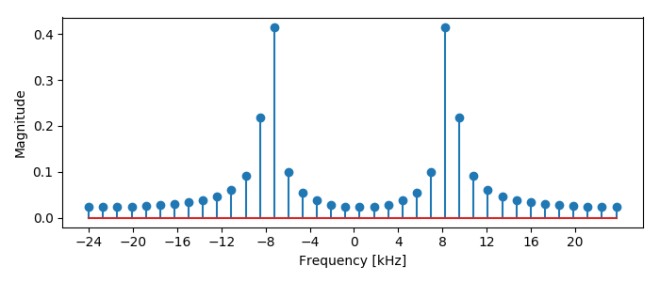
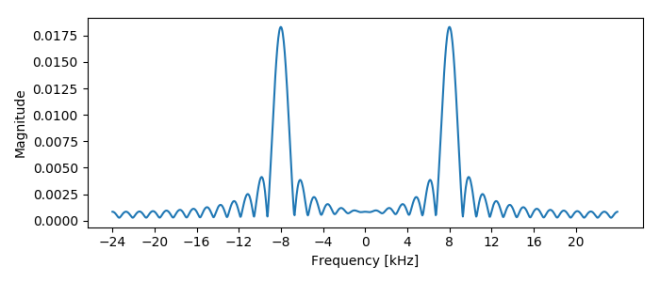
The normalized and shifted magnitude is presented below:
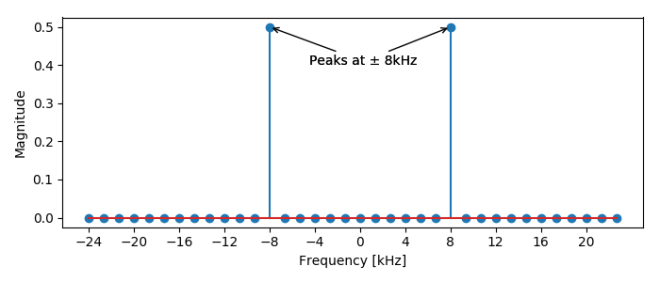
The result is perfect in this case. Two peaks at exact frequencies were obtained. Their amplitude corresponds to the actual signal power – two peaks sum up to 1, which is true for sine wave with amplitude 1.
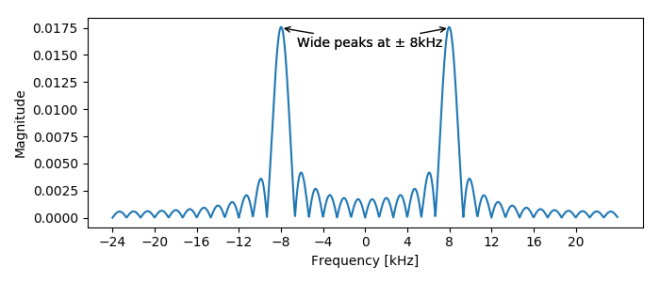
As mentioned before, the result can be less satisfying. It is common practice to use a power of two as a base for Fourier transform. If we do so and use first, higher power of two, namely 64 we can obtain following result:
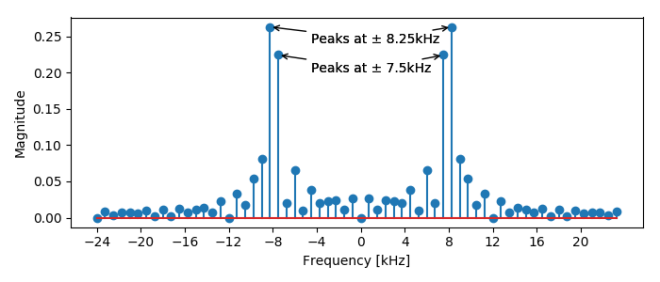
The spectrum gets messy and surely we cannot determine precisely the frequency of the signal, its power or the noise presence. One simple change introduced many uncertainties. Instead of two peaks we obtain two pairs of peaks at different frequencies and all other components, that we would expect to be zero are now non-zero.
This phenomena is called spectrum leakage – the power from the main peak leaks into the neighboring – the further they are the smaller the effect, but it is noticeable in whole spectrum.
Why does the spectral leakage occur? The FFT, or more precisely the DFT – discrete Fourier transform (FFT is just an algorithm that calculates the DFT) analyses the signal as if it were periodic. What does it mean and what does it imply?
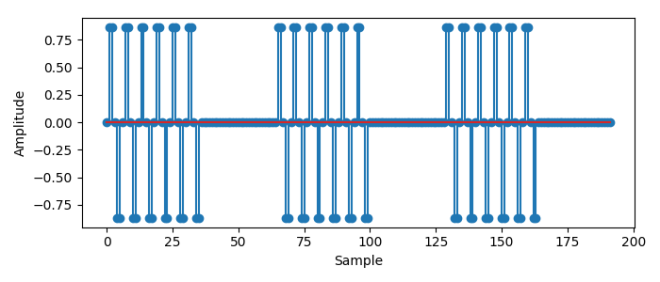
Two things are going on behind the curtains when we calculate the 64-point FFT in our case. The first one is padding – our signal is shorter then the FFT, which means it is padded with zeros. Our signal does not look the same after this operation. In the plot bellow I present the padded signal. FFT simply adds bunch of zeros at the end:
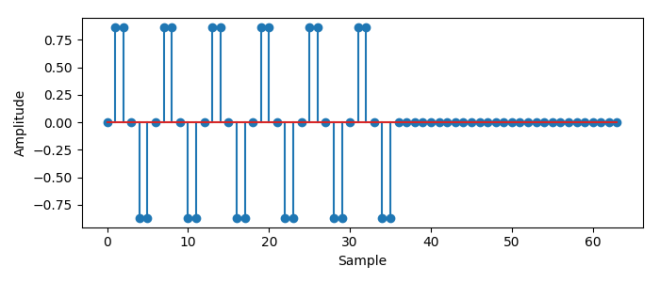
Only from this you can now expect that the spectrum will be distorted from the expected, perfect one. The sine wave ends rapidly, which means that there is discontinuity in the signal and this leads to extra high-order components in the spectrum.
Second aspect is aforementioned periodicity of the signal. This action is not directly applied on the signal, but for visualization purpose I prepared the repeated copies of the signal. When calculating DFT signal is assumed to be periodic, which means it starts to look something like this:
The number of copies is infinite and as stated before, they are created implicitly, which means that the periodic signal is not stored in the memory or on the disk – it is just treaded as if it were periodic. In this case padding is enough to mess with our spectrum, but in the second example, we will see that even without padding, the repetition of the signal can lead to unexpected results in FFT.
For the completeness reason I want to show also the result of FFT calculation for high N-point. I used 1024 -FFT to get such result:
Having increased “resolution” of the analysis, we can more precisely estimate the position of the peaks. This however, does not solve all our problems, because it is still hard to determine a few things. Is there a noise in the signal? Is this a clean sine wave or slightly modulated one? Is it 8kHz sine wave or 8.1kHz? Maybe there are both of them in the signal? What is the power of the signal (note that the height of the peak is disturbed by large amount of zeros added to the signal)?
Example 2 – signal length
To make things easier to follow I will use almost the same example as before. There is only one detail different, namely signal length. In this case we will use 38 instead of 36 samples.
We can start exactly as in previous case, with calculating FFT of size equal to the signal length.
You can see that we are dealing with the spectrum leakage from the beginning. This is caused only by implicit repetition of the signal, as padding does not occur if FFT size is equal to the signal length.
Let’s take a closer look at a signal if it gets repeated:
As you can see sine does not end with the end of the period and therefor, after repetition we get discontinuous signal. This is the root of our “problems” with the spectrum. DFT does not analyze pure sine wave, but rather the sine wave with discontinuity.
Increasing FFT size can let us do some guesses about the signal, but it is not best and final solution:
We received more or less similar spectrum as in previous example – wide peaks, increased “noise” level, unknown power of the signal.
Some of you might say, that in the second example we can still use 36-point FFT to get precise result. That is true, if we apply shorter FFT, the signal will be cut and we will obtain nice and clean sine wave, even after repetition. This solution is good only in this basic example. What if our signal would be more complex? Not single tone, but mixture of sine waves? Can we easily find such length that will remove the spectrum leakage? The answer is simple – NO!
Is there any way we can suppress the effect of spectral leakage? YES!
In the next post I will introduce and describe method for reducing effect of spectral leakage, namely windowing – stay tuned!

[…] the previous post I introduced the spectral leakage phenomena. Now you know where does it come from and how does it […]
LikeLike